
In our last post, we introduced the elements of our next generation infrastructure. Given the requirement of a local filesystem for Wordpress, we implemented Rook.io, a Kubernetes (k8s) native file cluster based around Ceph.
Rook has a number of advantages over using S3 storage. It supports Drupal and Wordpress sites transparently, and it reduces response time by avoiding network requests to an S3 provider. The internal architecture of Ceph -- around which Rook is built -- is flexible, scalable, and open source.
Yet, none of that comes free.
Holy Memory Allocation, Batman!
Ceph works a bit like S3 under the covers. Instead of files and directories, it only has a concept of paths and objects. In order to store or retrieve a while, Ceph must calculate where in the cluster the object is located, and then write or read the contents. For websites, most operations are reads, and not writes. To improve performance, Ceph will cache file metadata and content in active memory. This greatly reduces the total time to retrieve precious static assets like images, videos and aggregated CSS/JS.
When you install Rook using the Helm Chart, the default for this caching is a significant portion of the entire server (“node” as k8s calls it). In my implementation, that ended up being 4GB. To reduce intracluster network activity, it’s recommended to have a Rook storage controller, an “OSD”, present on the same node on which you run your workload. This creates an issue where Rook might allocate too much memory, push out production pods for your websites, or Out-of-Memory (OOM) the entire node.
Kubernetes provides a mechanism to control resource allocation for pods like the OSDs. You can add a resource section to your pod definition and specify a minimum and maximum amount of resources:
resources:
      	limits:
            	memory: 4000Mi
            	cpu: 1000m
      	requests:
            	memory: 1400Mi
            	cpu: 250m
The above example specifies a minimum of 1400M of memory, and a maximum of 4000M. The CPU spec, however, is a little...odd. K8s prefers to specify CPU in thousands of a percent of total allocation, often called millicpu or “millicores”. The above requests a minimum of 25% of a single core (250 milicores) with a limit of 1 entire core (1000 milicores).
While we could set this when setting up Rook, this creates a new problem.
No One Likes Evictions
When a pod exceeds the amount of CPU in it’s resource definition, k8s merely throttles what it can do. That can cause transient performance issues during a spike, but nothing more. When a pod exceeds memory allocation, however, k8s will kill the pod forcefully, shut it down and start up a new one. The dead pod is kept around in the evicted state, giving this mechanism its name: pod eviction.
If a pod powering a website gets evicted, that may result in a few requests getting dropped before the other replicas take over. When it happens to an OSD however, the entire storage cluster has a problem, and now so do all of your sites which rely on it. For this reason, it’s best to only set a high limit on your OSD pods. High enough that under normal operating conditions, you’d never approach it. You only want an eviction to occur in the case of a malfunctioning OSD.
Fortunately, Ceph has another mechanism to control memory allocation.
Stay On Target…
When you login to the Ceph control panel, you can navigate to Clusters > Configuration. In the table of configurable options, you can search for “memory”. There, you can find two of the most important settings for tuning memory use.
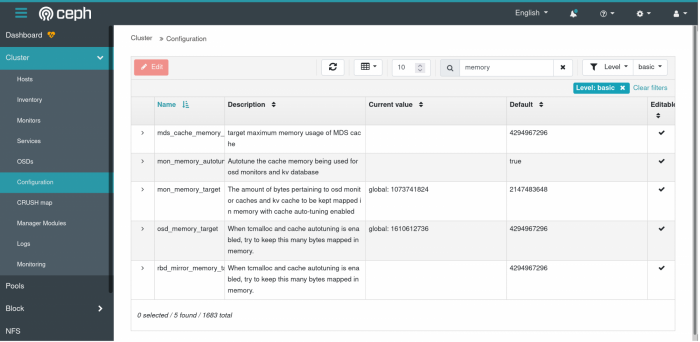
The most important one is osd_memory_target. This specifies -- if you haven’t guessed -- the ideal amount of memory for the OSD to allocate. By default, it auto-detects the maximum amount of memory on the node. Thankfully, we can override this setting without rebooting the file cluster.
In the above, I have the OSD configured to use around 1.5GB of memory. When applied, it does take effect immediately, but you will likely not see results for almost another hour. There’s a subtle balance in play here; less caching means more CPU and disk activity.
A similar setting is the mon_memory_target. Ceph Monitors (“mons”) are a parallel architectural component to OSDs. While the OSD retains file contents, mons retain file metadata. By default, they allocate a quarter of the total memory allocation of the node. Fortunately, we can tune this as well to a smaller number and reap some more memory savings.
But How Do We Arrive at Those Numbers?
While the memory targets are easy to set, it does beg the question, how do we get at those numbers? Sure, we can start with a percentage of the total node memory and go from there. But is there a more scientific way to arrive at those values?
One big problem with k8s is that you can’t easily get a pod’s resource allocation. You’d think you could use kubectl describe pod for this information, but what you get back is the values set in the resources section of the pod spec. Useless. In desperation, you may kubectl exec into a pod, and use top or free to get the allocation, but that just gets even more confusing…
$ kubectl --kubeconfig="path/to/my/kubeconfig.yaml" -n my-namespace exec -it some-pod-123456 -- free -m

Defaulting container name to web.
Use 'kubectl describe some-pod-123456 -n my-namespace' to see all of the containers in this pod.
          	total    	used    	free  	shared  buff/cache   available
Mem:       	7978    	4485     	417     	264    	3075    	3067
Swap:         	0       	0       	0
Wha…? The total memory available inside the pod is 8GB, the total available memory for this node. While that kinda makes sense, the used memory is over 4GB. Does that mean this individual pod is using 4GB? Nope! Due to the nature of how containers work, the output of tools like free is deceptive; it will show the total node’s.
Metrics To The Rescue
When researching this problem, the typical answers are to use kubectl top, or install a monitoring solution like Prometheus and Grafana to get pod-specific metrics. The latter is a significant effort, and clearly overkill when what we need is simple spot checking. If you run the former, however, kubectl will tell you there’s no metrics server installed. So, do we need to install Prometheus anyways?
Thankfully no. The Kubernetes Special Interest Group (SIG) provides a low-impact, open source metrics server. It’s also surprisingly easy to install:
kubectl --kubeconfig="path/to/my/kubeconfig.yaml" apply -f
https://github.com/kubernetes-sigs/metrics-server/releases/latest/download/components.yaml
Once installed, the metrics server will start up as a pod, and begin to gather usage information from the cluster. This can take a few minutes depending on load. Afterwards, you can use kubectl top to get basic usage information:
$ kubectl --kubeconfig="path/to/my/kubeconfig.yaml" -n my-namespace top pods

NAME               	CPU(cores)   MEMORY(bytes)
memcache-0         	1m       	63Mi
memcache-1         	1m       	58Mi
memcache-2         	1m       	61Mi
web-1234567890-abcd   5m       	278Mi
web-1234567890-bcde   5m       	258Mi
web-1234567890-cdef   4m       	270Mi
With this, we can finally see the allocation of our pods, including our Rook-Ceph pods. Ideally, we would monitor the usage continuously, under both low and high loads, to get a sense of our tuning values for osd_memory_target and mon_memory_target. Running kubectl top can help, but an alternative like the k9s CLI can provide a better user experience. Neither, of course, replaces a proper monitoring solution like Prometheus and Grafana, but it’s good enough for our needs here.
Wait, What About All Those Other Pods?
So far, our focus has been on tuning Rook-Ceph to keep our file cluster happy and healthy. Now that we have more information, however, what about all those other pods on our cluster?
When implementing Kubernetes, many will either set the pod resources too high so as to avoid eviction, or not set them at all. This has some serious implications for how Kubernetes will provision pods. Without a resource spec, k8s will “round-robin” pod scheduling. That is, the first replica of any deployment or statefulset will land on the first node in the cluster. The second replica on the second node, the third the third, and so on.
This is a sensible default, but consider if you have multiple deployments, some with a replica count of 3, some with 2, and 1 for others. The result is the first node in your cluster is constantly under the most load, while the other nodes are underutilized:
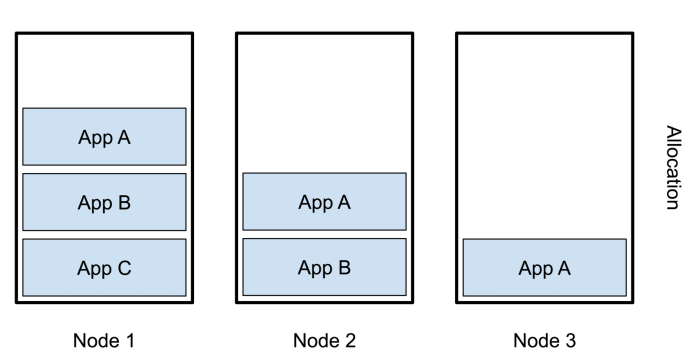
In the graphic, app A has three replicas, B has two, and C has one. Since we’re using round-robin scheduling, A is now on each node, B on nodes 1 and 2, and C only on node 1. As a result, node 2 and particularly 3 are not being used as fully as they could be.
Setting the resources spec changes the behavior k8s. Now, it will attempt to fill up one node at a time:
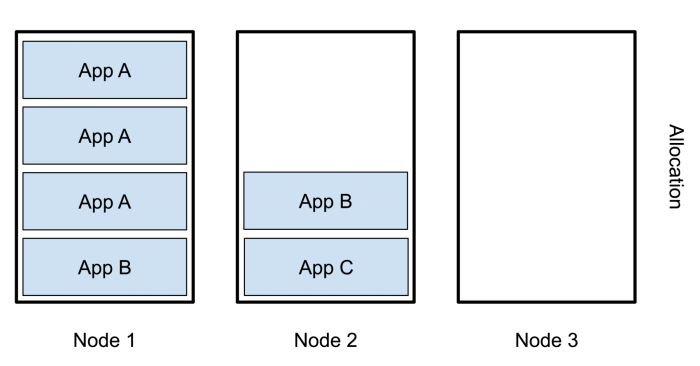
Now All of app A is on node 1, B is split between nodes 1 and 2, C is only on 2, and node 3 is completely empty. We’ve actually made the problem worse!
Is there any way out of this? Thankfully, yes.
Anti-affinities To The Rescue!
A key problem is that we have multiple replicas of the same application all on the same node. We’d rather avoid that, so that each node has a more balanced load. One way to achieve that is to use a Pod AntiAffinity.
Affinities are a replacement for Node Selectors. They allow you to specify a series of rules to control how and where to schedule a pod. A common use is to have several nodes in your cluster labeled by capability, and then schedule pods which require that capability only on those nodes:
 affinity:
   nodeAffinity:
   requiredDuringSchedulingIgnoredDuringExecution:
   nodeSelectorTerms:
    	- matchExpressions:
         - key: doks.digitalocean.com/node-pool
           operator: In
           values:
             - web-pool
The above instructs k8s to schedule the pod only on nodes with the label doks.digitalocean.com/node-pool and value web-pool. That is, the node pool name on DigitalOcean Kubernetes.
What we really want to do, however, is prevent two replicas from the same application to schedule on the same node. In this case, our application is labeled web. So how do we prevent it from scheduling more than one per node? We use an anti-affinity, combined with both the application label and the node hostname:
  affinity:
    podAntiAffinity:
    	requiredDuringSchedulingIgnoredDuringExecution:
       - labelSelector:
         matchExpressions:
          	- key: app
             operator: In
             values:
               - web
         TopologyKey: kubernetes.io/hostname
This tells k8s not to schedule our replicas on the same node. This is not only useful for our production website nodes, but we can also apply it to our Rook OSDs and mons.
Conclusion
It’s easy to add new technology to a cluster. But without some guidelines on how resource allocation is done, you’re prone to leaving your cluster open for over provisioning and outages. To make more informed choices on resource constraints, we need better data. Using a metrics server and existing command line utilities like kubectl top or k9s allows us to get that data.
Once we know the approximate resource usage of each pod, we can bound its allocation by including a resources section in our pod spec. Furthermore, we can control how, where, and with whom our pods are provisioned so as to better balance the utilization of each node. And with better balance, comes better, consistent performance cluster-wide.